A popular adage—or excuse, depending on your perspective—is that a software development team must spend roughly 80 percent of its time on bug-fixing and code maintenance, which leaves little time for innovation. Whatever the actual percentage may be, this problem tends to plague businesses whose software has been in the market for a while. They'd prefer to move on to their next cool idea, but they need to support the products that support their business today. For new businesses with new ideas, this may be less of a problem—for now.
At several recent conferences, including Velocity, we've heard industry professionals say that well-established, software-enabled companies and projects should consider moving toward continuous delivery based on microservices architectures rather than monolithic architectures. Netflix, Amazon, and Ebay, among others, have moved in this direction. But when most companies have only 20 percent of total available time to spend on application work to architecture and software delivery, there's little time for real innovation.
What's needed is a quality (r)evolution—a "shift left" in quality focus on DevOps metrics to identify problems as early in the development lifecycle as possible. Quality has to be given the same careful attention as a feature requirement.
But what do we shift left? How would that work?
What I've been seeing is that 80 percent of software defects are caused by a small number of classic problem patterns: poor choice of frameworks, inefficient database access, wasteful memory allocations, bad algorithms causing CPU spikes, inappropriate synchronization of shared resources, or "logging to death," etc.
In my work helping software organizations identify these problems, I've come to the conclusion that the best solutions result from good architectural metrics—starting at the developer's machine before checking in code and automating it in continuous integration by analyzing unit- and integration-test execution. One architectural metric for web development should be the number of resources (images, JavaScript, CSS, etc.) on a web page. Before checking in changes, a developer needs to use built-in browser diagnostics tools to make sure the page isn't overloaded with too many elements. The same metric can then be verified with a Selenium test executed in continuous integration.
Spotlight on the number of SQL statements
Often, I find that applications are inefficient at accessing data from the database. An excessive amount of SQL calls, either requesting too much data or running inefficient SQL are at the top of the list. Let me guide you through one example to show how a shift-left approach could greatly improve an app in production.
Operations issue: Ensure that configuration changes don't cause high database overhead
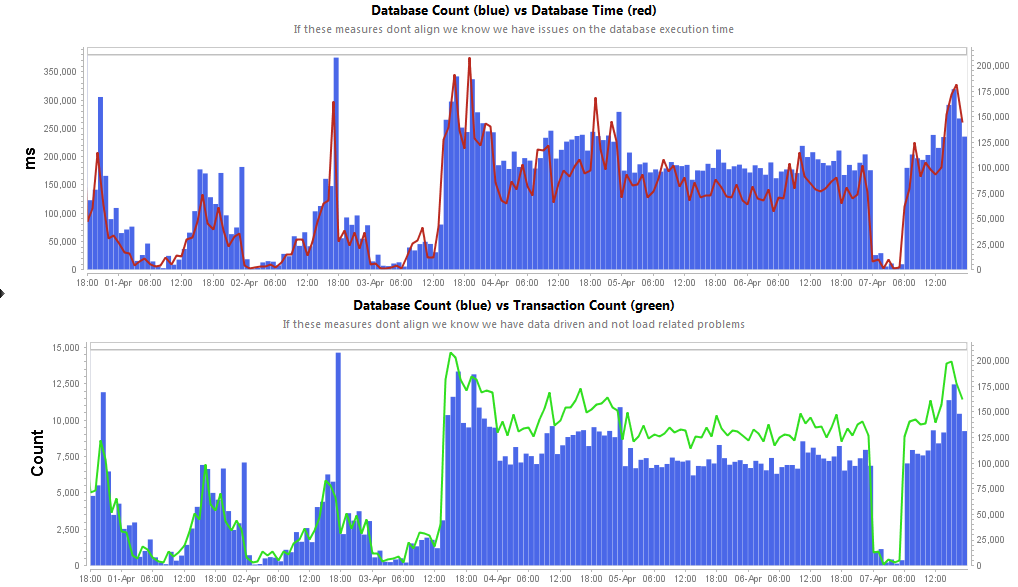
The following two diagrams show the number of SQL calls executed in a production environment. The change in behavior happened after a new version of the software was deployed, which caused performance degradation, overloaded database servers, and a lot of people spending a lot of time figuring out how to fix it.

We learned that the engineering team made a change in the way they use their O/R Mapping Framework Hibernate. A bad configuration change caused Hibernate to execute many more SQL queries than before to produce the same result.
Development issue: Look at the number of SQL statements
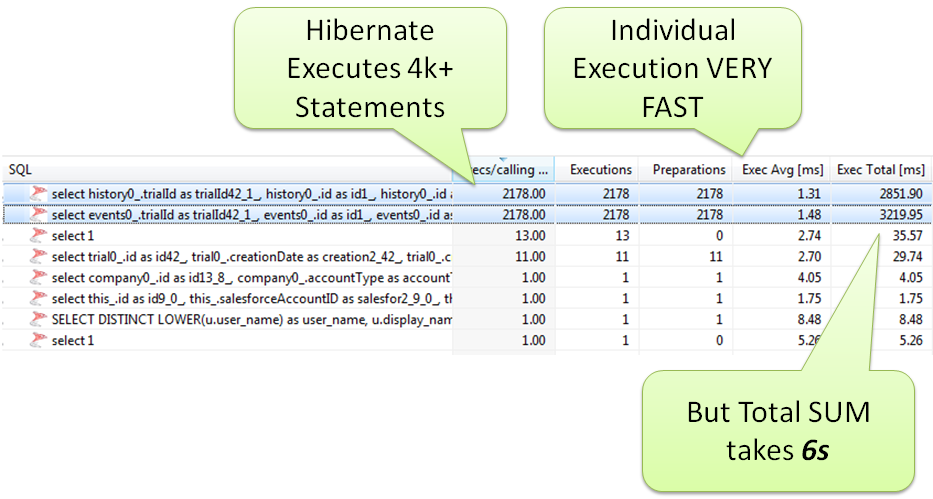
This problem could have been identified at the workstation if the developer had examined the number of SQL statements executed after making the configuration change before checking in that change. Hibernate, like other frameworks, provides built-in logging and diagnostic output to identify this behavior. Here is the output as seen on the developer's machine (the green labels are mine):

Though functionally correct, this code should not be allowed into your code repository. It clearly violates architectural rules.
Testing issue: Automate architectural metrics collection
Most testers do a great job at creating functional tests, no matter what test automation tools they're using. But a shift-left in quality means that testers also need to start looking at these technical architectural metrics. The successful agile teams I see help testers automatically capture the number of SQL statements for every test they execute. Automating this task removes the burden on engineers to manually do this before checking in code.
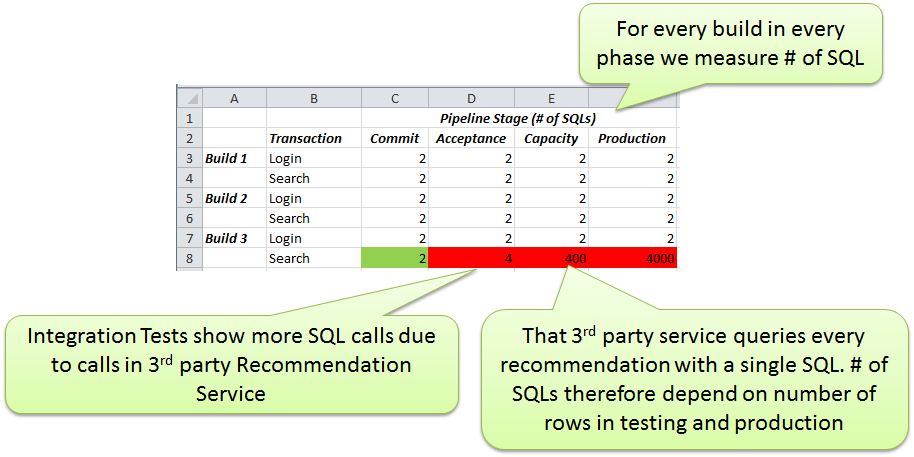
The benefit to developers is clear: after checking in code, you get feedback about any changed behavior from the automated tests. The following table offers a simplified view of this, showing how every test in every build automatically looks at the number of SQL statements.

If we see a regression based on this metric in this table, it's easy to stop the build from moving forward. That's especially helpful when executing these tests on a test setup that contains more test data in the database than what developers have available in their local dev instance.
Other valuable DevOps metrics: Number of images, service calls, etc.
There are many other metrics to consider along your delivery pipeline. For web developers, it's critical to look at key web performance optimization metrics, such as the number of images, CSS files, or JS files on a page. For architects of service-oriented applications, it's critical to understand how the services communicate with each other, how much data is transferred per service call, and how many resources are bound. These are all metrics that need to be gathered early on, as well as throughout the delivery process all the way into your live system.
First step: Pick one metric and start shifting it left
While it may be difficult to adopt these practices, I recommend that you pick one metric—something that's truly measurable—and let your teams figure out how to monitor this metric along the delivery pipeline. Try automating and reporting it for every single build and test you execute, all the way into production. Watch this metric over time and see how this simple practice creates a totally new way of looking at quality, right from the start.
Keep learning
Take a deep dive into the state of quality with TechBeacon's Guide. Plus: Download the free World Quality Report 2022-23.
Put performance engineering into practice with these top 10 performance engineering techniques that work.
Find to tools you need with TechBeacon's Buyer's Guide for Selecting Software Test Automation Tools.
Discover best practices for reducing software defects with TechBeacon's Guide.
- Take your testing career to the next level. TechBeacon's Careers Topic Center provides expert advice to prepare you for your next move.


