Enterprise service management (ESM) is changing the landscape of corporations worldwide. The concept is pretty straightforward. Much as IT services are managed according to the 50-year-old discipline of IT service management (ITSM), you can manage non-IT enterprise services such as HR, facilities, and security by using a similar set of principles and frameworks.
By adopting an ITSM framework, your enterprise services can bypass 50 years of incremental, trial-and-error improvement and achieve process maturity in a matter of months, not years or decades. You can achieve the goal of ESM: to deliver higher-quality enterprise services at a lower cost, within a framework of industry best practices.
I've written about the eight most important KPIs for ITSM, and these are just as effective for measuring and monitoring the effectiveness of ESM. Here, however, I focus not on those eight tactical metrics, but on the strategic metrics of ESM. So, what’s the difference?
- Tactical metrics are what you use to manage day-to-day operations. They fall into three broad categories: cost, quality, and speed. Cost per ticket, customer satisfaction, and mean time to resolution are among the most common tactical measures for both ITSM and ESM.
- Strategic metrics, by contrast, measure the business effectiveness of a function and include ROI, channel mix, tickets prevented, and process maturity.
Remarkably, very few ESM groups track strategic metrics. Instead, they focus almost exclusively on the tactical metrics of ESM: cost, quality, and speed.
Here are the top strategic KPIs of ESM that your team should consider.
The strategic KPIs of ESM
Tactical metrics measure the effectiveness of day-to-day execution, while strategic metrics ensure that you are executing against the right objectives.
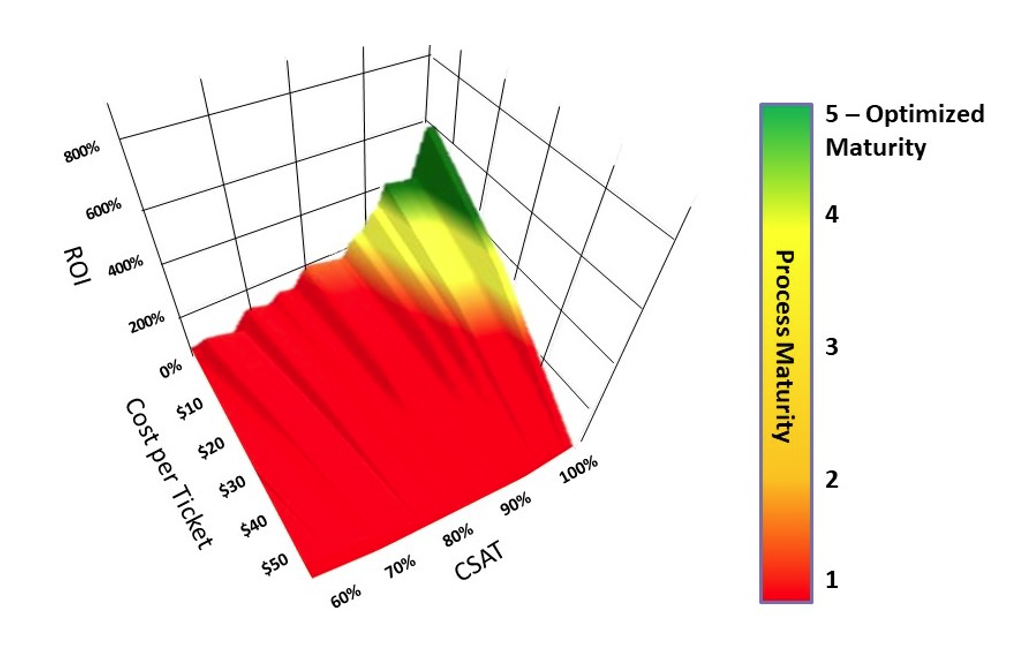
Figure 1: The relationship between tactical and strategic KPIs for ESM
Customer satisfaction and cost per ticket, both tactical measures, are illustrated on the x- and y-axes respectively in Figure 1 above. These are also called foundation metrics because everything you do in service and support boils down to cost and quality: minimizing cost while maximizing quality.
The other two metrics on the diagram—ROI and process maturity—are strategic KPIs. The three-dimensional surface has been color-coded to show good outcomes (green) and poor ones (red). Good outcomes correspond to high customer satisfaction, low cost per ticket, and high ROI. The thermometer image on the right shows that process maturity is key to achieving the most desirable outcomes. As processes mature, you get better outcomes, both strategically and tactically.
Return on investment
If ESM is a viable business proposition it should yield a positive, compelling ROI. The ROI is a simple ratio. The numerator is return, or the business value created by ESM, and the denominator is the investment, or the annual operating cost of ESM.
The return in our ROI ratio has two components. One is the savings in ESM operating costs that results from the transformation to ESM. The second is the monetized value of the productivity returned by ESM. So, for example, if ESM saves every person in your enterprise 48 hours per year (a fairly typical outcome), you can monetize that cost savings.
The first component of return comes from the savings in the ESM operating cost itself and can be estimated as follows:
- The average G2000 company will spend about 50% of its operating budget on enterprise services.
- A successful ESM transformation will reduce that number to around 30% while simultaneously improving the quality of ESM services.
- This produces a savings of 40% on ESM costs, which contributes to the return in ROI.
The second component of ROI is the productive hours returned to enterprise customers who rely on enterprise services. The average employee in the Global 2000 costs about $110,000 per year, including salary, benefits, and overhead. A typical work year is about 1,800 hours. So, the average hourly cost of a Global 2000 employee is about $61 ($110,000 per year ÷ 1,800 hours of work per year). The productivity savings from ESM are therefore about $2,928 per full-time equivalent (FTE) job in the Global 2000 ($61 per hour x 48 hours saved per year).
Now, let’s assume that we are calculating the ROI from ESM in a company with 10,000 employees. The “average” G2000 company with 10,000 employees will have about $1.5 billion per year in operating expense. We can estimate that before ESM the company would spend about $750 million per year on enterprise services (50% of annual operating expenses), whereas after ESM it would spend approximately $450 million on enterprise services (30% of annual operating expense). This is the denominator of the ROI calculation.
The numerator of the ROI calculation will be the sum of the ESM savings due to transformation, estimated to be $300 million ($750 million pre-ESM, $450 million post-ESM), plus the annual productivity savings due to ESM, which we can estimate to be about $29.3 million ($2,928 in returned productivity per employee X 10,000 employees). The ROI is therefore ($300 million saved in operating cost + $29 million in returned productivity) ÷ ($450 million in post ESM operating cost per year) = 73%.
A 73% ROI for an ESM transformation is not atypical. Moreover, this is not a one-time benefit. The cost savings and productivity improvement that result from a successful ESM transformation will be recurring, year after year.
For anyone who is hesitant to begin the ESM journey, the expected ROI of an ESM transformation should be central to your business case for proceeding.
Channel mix
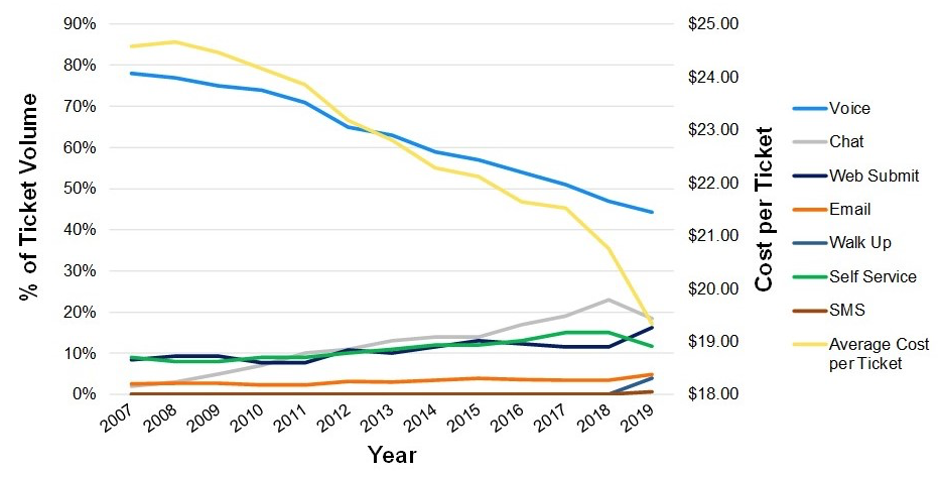
Channel mix is the percentage of incoming tickets that arrive at the enterprise service desk through various channels. The most common channels include walk-up, voice, email, web, chat, and self-help. Channel mix in ESM is rapidly evolving (see Figure 2 below) and is considered one of the industry’s mega trends. In 2007, voice calls represented almost 80% of all ticket volume. Today, they represent less than 50% of the volume.
There are both economic and demographic key drivers behind this trend. The key economic driver is that voice, which has dominated the industry for decades, is one of the most expensive channels, while chat, email, web, and self-help all cost less.
Customers like channel choice, and as ESM customers adopt and adapt to lower-cost channels, the average cost per ticket decreases accordingly, as shown in the yellow cost per ticket line in the diagram. Since 2007, the average cost per ticket has decreased from nearly $25 to about $19.50.
Figure 2: Evolving channel mix reduces the average cost per ticket
What about the demographic drivers behind channel mix? If you look at a spectrum of IT users, from those who are newest to the workforce, to those nearing retirement, younger users tend to prefer self-help or the indirect channels of chat and email, while those who have been in the workforce for some time lean much more heavily toward live voice as their go-to channel for support. This trend will continue as newer workers continue to enter the workforce.
Tickets prevented
“The best ticket is the ticket that never happens!” I first heard this truism nearly 30 years ago, and today it’s truer than ever. Preventing a ticket in the first place is always better than handling one triggered by an incident or a service request. But can you prevent tickets from happening, and is there a way to measure tickets prevented? The answer to both questions is yes.
To measure tickets prevented you must start by measuring another, baseline metric: tickets per user per month (the number of tickets handled divided by the number of users supported). For example, if you handle 10,000 tickets per month, and support 8,000 users, the number of tickets per user per month is 1.25 (10,000 tickets ÷ 8,000 users).
Now assume that you measure tickets per user per month one year later at the same service desk and find that you are handling 9,000 tickets from 8,500 users. Your tickets per user per month is now 1.06 (9,000 tickets ÷ 8,500 users). The number has been reduced by 0.19 (1.25 – 1.06). Finally, to estimate how many tickets you're preventing each month, multiply the reduction in tickets per user per month by the number of users supported (0.19 tickets per user per month prevented x 8,500 users). That comes to 1,615 tickets prevented per month versus the baseline from one year earlier.
The ITIL discipline devoted to preventing tickets, called problem management, also applies to ESM. I have seen large enterprises cut ticket volumes in half by maturing problem management, saving millions of dollars per year in the process.
Some people have argued that an effective self-help portal can also reduce ticket volumes. But while self-help can reduce the number of agent-assisted tickets, whether or not it returns productive time to the end user is debatable. As a general rule of thumb, users should not be spending more than 10 minutes at a time in the self-help portal. Any more than that, even if the user eventually finds a workable solution, costs the enterprise more in lost productivity than it saves in direct support costs.
Process maturity
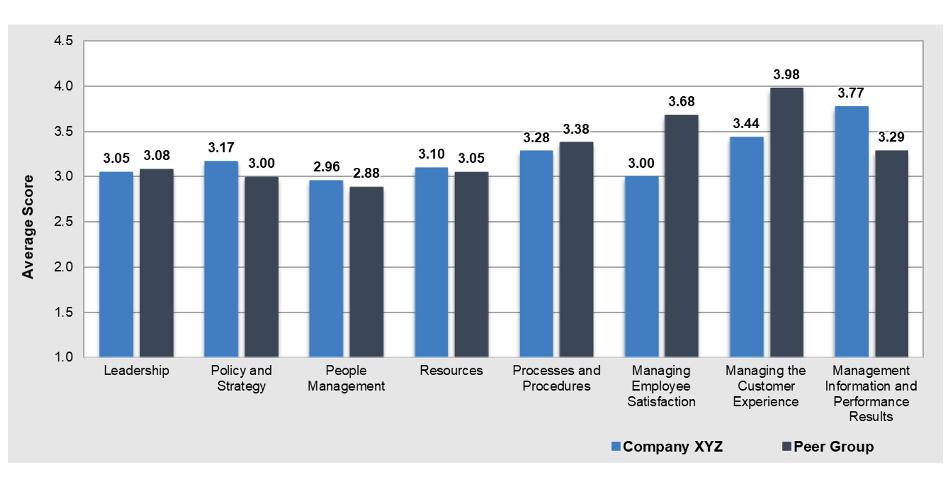
Process maturity is the final strategic metric in ESM. It involves measuring the maturity of the service delivery processes that incorporate industry best practices. One globally recognized assessment that's used frequently to measure process maturity is the SDI Global Best Practices Standard. It addresses leadership, policy and strategy, people management, resources, processes and procedures, managing employee satisfaction, managing the customer experience, and management information and performance results.
The assessment measures maturity on a scale of 1 to 5 for 130 documented industry best practices. Figure 3 below shows one output from the SDI process maturity assessment.
Figure 3: SDI Global Best Practices Process Maturity Assessment sample output
Process drives performance, so as your ESM processes mature you'll see better outcomes in both your strategic and tactical ESM metrics. In addition, the results of your process maturity assessment will provide a road map for continuous improvement. By focusing on and improving process areas that are weak, your enterprise service desk can improve its process maturity over time and achieve continuous improvement in the tactical metrics of ESM as a result.
Get tactical—and strategic
Effective management of ESM requires both tactical and strategic metrics. The tactical metrics tell you how well you are executing, while your strategic metrics indicate whether you are executing against the right objectives, such as maximizing ROI, optimizing your channel mix, preventing tickets, and maturing your industry best practices. For any ESM organization that's interested in doing the right thing, in addition to doing things right, the strategic metrics of ESM are critical to success.
To learn more about the KPIs of enterprise service management, attend Jeff Rumburg’s session, "Enterprise Service Desk: The Greatest Opportunity in a Generation," at SDI21 Live & Interactive, or watch his Brighttalk webcast, "Enterprise Service Management (ESM) Is Here to Stay."
Keep learning
Choose the right ESM tool for your needs. Get up to speed with the our Buyer's Guide to Enterprise Service Management Tools
What will the next generation of enterprise service management tools look like? TechBeacon's Guide to Optimizing Enterprise Service Management offers the insights.
Discover more about IT Operations Monitoring with TechBeacon's Guide.
What's the best way to get your robotic process automation project off the ground? Find out how to choose the right tools—and the right project.
Ready to advance up the IT career ladder? TechBeacon's Careers Topic Center provides expert advice you need to prepare for your next move.


